S&P500 Daily Action Areas & Price Targets 13/7/26

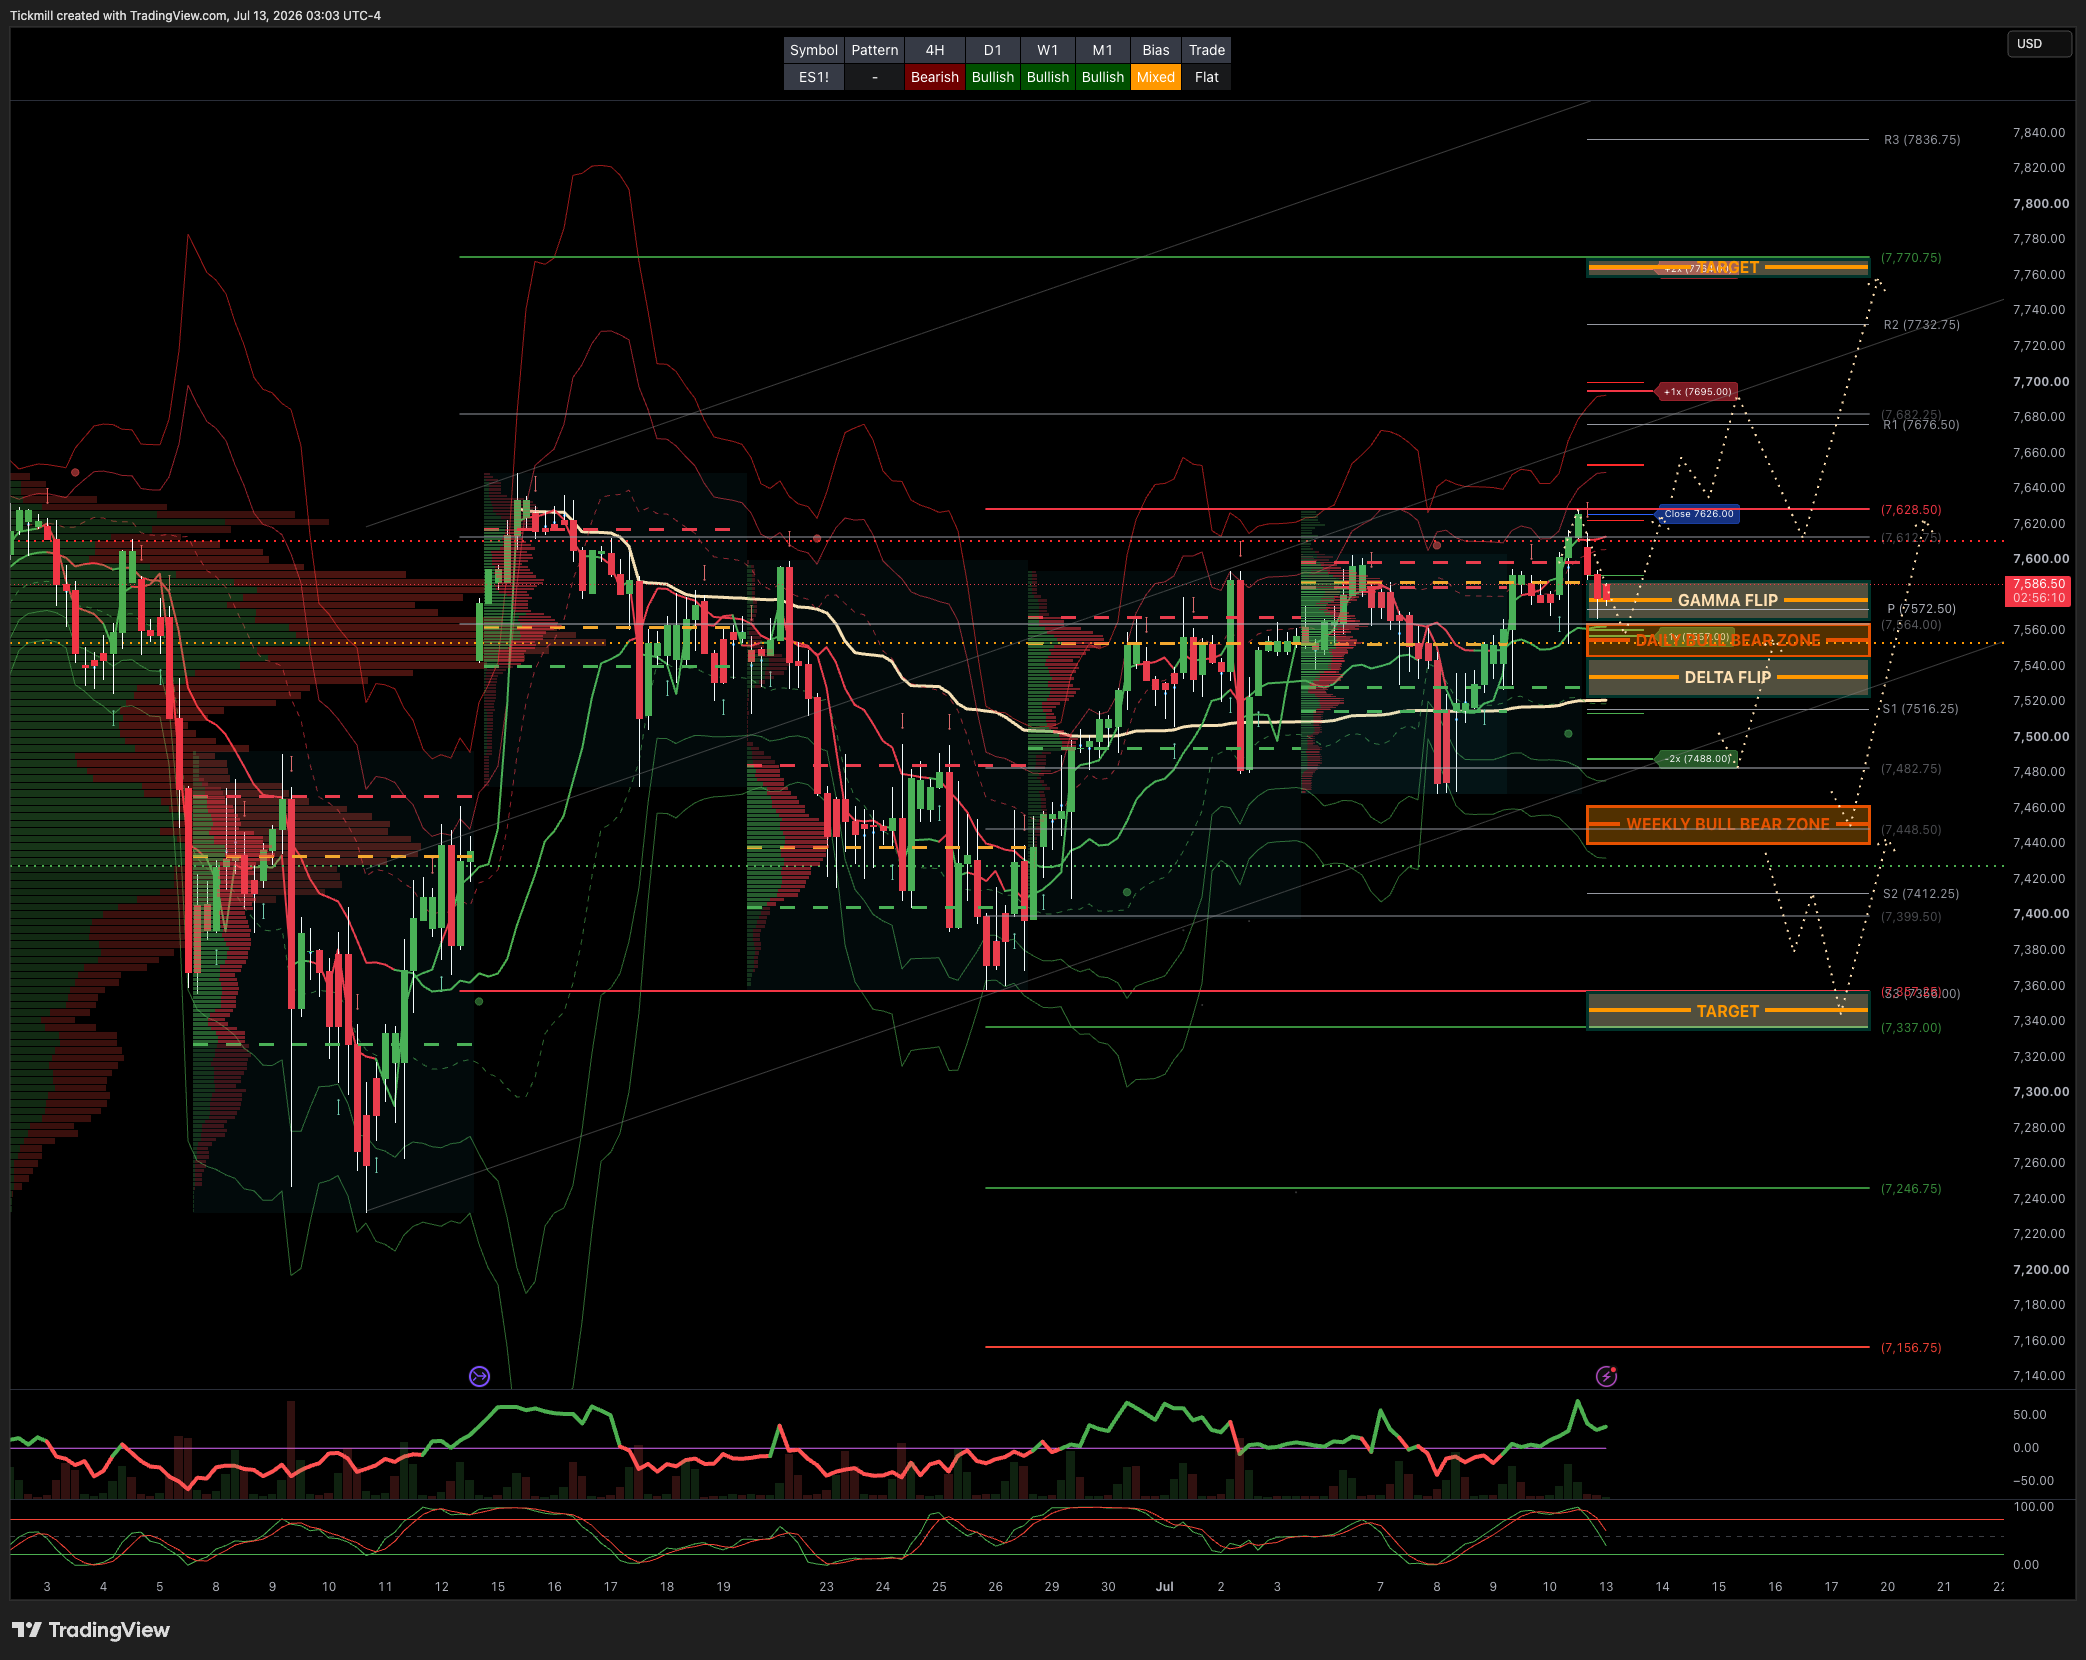
S&P500 Daily Action Areas & Price Targets 13/7/26
***QUOTING ES1! FOR CASH US500 EQUIVALENT LEVELS, SUBTRACT POINT DIFFERENCE***
WEEKLY BULL BEAR ZONE 7460/40
WEEKLY RANGE RES 7710 SUP 7530
MONTHLY RANGE RES 7932 SUP 7384
JHEQX Q3 Collar Short Call Cap: ~7,750 – 7,900 - Long Put Strike: ~7,050 – 7,100 (approx. 5% downside protection) Short Put Strike: ~5,950
DEC2025 OPEX to DEC2026 OPEX is 945 points giving us a range of [5889,7779]
SPX PUT/CALL RATIO 1.12 (The numbers reflect options traded during the current session.) A put-call ratio below 0.7 is generally considered bullish, and a put-call ratio above 1.0 is generally considered bearish.
GS Flow Desk: large S&P 31Aug 7000/7950 strangle in roughly $20mm vega / $115mm premium …My Read – classic “big convexity versus carry” trade: either someone paid a lot to own a wide August move, or someone got paid a lot to bet that the S&P stays comfortably inside the 7000–7950 corridor
DAILY VWAP BULLISH 7567
WEEKLY VWAP BULLISH 7527
MONTHLY VWAP BULLISH 7036
DAILY STRUCTURE - OTFH 7552
WEEKLY STRUCTURE - BALANCE 7648/7247
MONTHLY STRUCTURE - OTFH - 7199
Balance: This refers to a market condition where prices move within a defined range, reflecting uncertainty as participants await further market-generated information. Our approach to balance includes favouring fade trades at the range extremes (highs/lows) while preparing for potential breakout scenarios if the balance shifts.
One-Time Framing Higher (OTFH): This represents a market trend where each successive bar forms a higher low, signalling a strong and consistent upward movement.
One-Time Framing Lower (OTFL): This describes a market trend where each successive bar forms a lower high, indicating a pronounced and steady downward movement.
DAILY BULL BEAR ZONE 7540/50
GAMMA FLIP 7563
DELTA FLIP 7515
DAILY RANGE RES 7655 SUP 7517
2 SIGMA RES 7724 SUP 7448
VIX BULL BEAR ZONE 17.4
TRADES & TARGETS
LONG ON REJECT/RECLAIM DAILY BULL BEAR ZONE TARGET CLOSE > DAILY RANGE RES
***ADDITIONAL SETUPS & TARGETS HIGHLIGHTED ON THE CHARTS***
(I FADE TESTS OF 2 SIGMA LEVELS ESPECIALLY INTO THE FINAL HOUR OF THE NY CASH SESSION AS 90% OF THE TIME WHEN TESTED THE MARKET WILL CLOSE ABOVE OR BELOW THESE LEVELS)
GOLDMAN SACHS FICC & EQUITIES TRADING DESK VIEWS
Market Setup — Smooth Sailing Priced, but Protection Is Cheap
The tape has moved fully into summer mode. Cash volumes have declined sharply since the start of July, the VIX briefly traded with a 14 handle on Friday, the 1-week SPX straddle is priced like a New Year’s holiday week, the S&P is only around 50bps from another record high, and the GS panic indicator closed with a 1 handle, its lowest level in two years. In short, the market is pricing a very benign runway into earnings season.
That benign pricing is the key point. The index is calm, realized volatility is low, and positioning no longer looks overtly stressed at the headline level. But under the hood, there is a lot more noise: credit is wobbling, implied correlation is at record lows, levered ETF activity is enormous, single-stock upside vol is expensive, and hedging activity is disappearing. The setup looks less like a market that should be aggressively faded outright and more like one where the risk/reward has shifted toward taking some chips off the table or adding cheap protection.
Tony Pasquariello’s line is apt: there are times for the accelerator and times for the brake. In the very near term, this looks more like a brake moment. That does not mean turning bearish on equities structurally, especially with the S&P near highs and earnings season about to begin. But when volatility is this low and the market is this complacent, the cost of insurance is unusually attractive. The market is not charging much for protection, and that alone argues for owning some.
The biggest new concern is the role reversal between credit and equity vol. This week, credit colleagues sounded meaningfully more nervous than equity vol colleagues, which is unusual given how calm SPX price action has been. Words like “carnage” were reportedly being used on the credit desk, while the S&P was trading in 30bp intraday ranges. The core issue is that there has been a lot of technology issuance, and markets are starting to push back. The simplified version is too much, too fast.
The GS hyperscaler bond basket widened 22bps last week, which is a large move for that part of the market. This deserves attention because hyperscaler equity stories are deeply tied to AI capex, balance-sheet capacity, and the market’s willingness to finance massive infrastructure spending. If credit begins to penalize the scale and pace of AI-related issuance, that becomes a more important constraint on the equity narrative. Equities may still be focused on earnings growth and AI demand, but credit is starting to ask whether the funding machine is being overused.
This links directly to the broader AI debate. Equity investors have spent the past few weeks rotating within the AI complex: out of hyperscalers and legacy TMT, into semiconductors, then partially back into selected data center and infrastructure names after the momentum washout. But if hyperscaler credit continues to widen, it could become the next pressure point. The long-term market will reward capital discipline and punish excessive AI capex eventually; credit may be the asset class that starts sending that message first.
The second major signal is implied correlation hitting the lowest level in history. This is one of the cleanest expressions of the current market regime. Index vol is suppressed, single-stock dispersion remains elevated, and the market is pricing an environment where names move idiosyncratically rather than together. That makes sense heading into earnings season, but record-low implied correlation also means the bar for continued calm is high. At some point, either single-stock vol comes down, index vol moves up, or realized correlation rises.
There are two suggested ways to express a view that realized correlation or index-level volatility can rise from here. The first is to go long the GS reverse dispersion index, GSVIU17I. Historically, current levels of correlation have offered a good entry point for that type of trade. The second is through SPX top-50 volswap structures, going long a ratio of index vol versus short a weighted basket of single-name vol. Both trades are designed to benefit if the extreme dispersion regime starts to normalize.
Prime brokerage flows show that hedge funds were net buyers of equities for the first time in four weeks, but the composition was not especially risk-on. The buying was driven by short covering rather than fresh long additions, with short cover outpacing long buys by 6.5 to 1. That led to the largest single-stock de-grossing period in more than three months. This is important because index strength supported by short covering can persist in the short run, but it is less durable than genuine long accumulation.
Sector-level flows continue to show churn rather than broad conviction. Info Tech was the most net-bought sector on the week, but that buying reflected rotation out of hyperscalers and legacy TMT into semiconductors. So the market is still rotating within AI/tech rather than making a clean directional statement. Financials, meanwhile, are being sold into a massive earnings week, with five of the largest banks reporting on Tuesday. That will be an important early test of credit conditions, capital markets activity, deposit betas, loan growth, and the broader risk appetite backdrop.
The one-delta desk also highlights how quiet the tape has become. Cash volumes have fallen sharply since early July, institutional activity has been muted, and portfolios appear largely set for earnings season. The desk finished slightly better to buy across the momentum factor, but this seems more like positioning maintenance than an aggressive risk-on impulse. With lower liquidity, however, even modest flow can have an outsized impact, especially in crowded themes and levered ETF-linked exposures.
The futures market shows a major shift back toward the long dollar / US exceptionalism trade. Non-dealer US dollar positioning is now at some of the highest nominal levels in the past decade, based on both CFTC data and GS FX positioning scores. This is a meaningful reversal from the recent “debasement trade” narrative that dominated investor conversations not long ago. GS has updated FX targets toward a stronger dollar, which fits with higher-for-longer US yields, low recession risk, and renewed carry interest funded by low-yielders.
That stronger-dollar backdrop matters for equities and commodities. A firmer dollar can tighten financial conditions at the margin, pressure multinational earnings translations, and weigh on EM assets. At the same time, it supports the broader G10 FX carry theme: if US exceptionalism is back and volatility remains low, long USD-funded or USD-receiving expressions can continue to work, particularly versus low-yielders or risk-sensitive currencies. But crowded long-dollar positioning also means the trade is increasingly vulnerable to a dovish data surprise or a Fed repricing.
In derivatives, the lowness of SPX implied volatility is becoming difficult to ignore. Despite the lack of realized index moves, the GS index vol desk saw an uptick in hedging activity, particularly in 2-month SPX downside. That makes sense: earnings season, geopolitical oil risk, hyperscaler credit widening, and record-low implied correlation all create reasons to own protection, while the market is pricing a very low-volatility path. The asymmetry is improved because hedges are not expensive.
Single-stock option pricing is more conflicted. Average stock call skew is almost at parity, meaning the 25-delta call and at-the-money implied vols are nearly the same, while average stock put skew is trading near 10-year lows. This is a remarkable statement about investor behavior: demand for upside convexity in single names remains very strong, while demand for downside protection has faded. It fits the broader theme that hedging is disappearing, but it also creates a risk if earnings disappoint. Upside is expensive in many names, while downside protection screens cheap.
Another striking stat: the average SPX stock 1-month 25-delta call trades around 30 vols over the representative index. That means single stocks face two high bars into earnings season. Fundamentally, companies need to beat elevated expectations. Optionally, they also need to overcome very expensive upside convexity pricing. For many names, good earnings may not be enough if the move is already richly priced in the calls.
Levered ETFs remain one of the defining market-structure stories of 2026. Notional volume exposure in US levered ETFs reached around $3tn at the end of June, an extraordinary figure. This follows the broader point that levered ETFs are now a major contributor to intraday and close-to-close market dynamics, especially in semis, AI, crypto-linked equities, and high-beta thematic baskets. These vehicles can amplify momentum in both directions through rebalancing flows, particularly when liquidity is thin and investor participation is seasonal.
Disclaimer: The material provided is for information purposes only and should not be considered as investment advice. The views, information, or opinions expressed in the text belong solely to the author, and not to the author’s employer, organization, committee or other group or individual or company.
Past performance is not indicative of future results.
High Risk Warning: CFDs are complex instruments and come with a high risk of losing money rapidly due to leverage. 69% and 73% of retail investor accounts lose money when trading CFDs with Tickmill UK Ltd and Tickmill Europe Ltd respectively. You should consider whether you understand how CFDs work and whether you can afford to take the high risk of losing your money.
Futures and Options: Trading futures and options on margin carries a high degree of risk and may result in losses exceeding your initial investment. These products are not suitable for all investors. Ensure you fully understand the risks and take appropriate care to manage your risk.
Patrick has been involved in the financial markets for well over a decade as a self-educated professional trader and money manager. Flitting between the roles of market commentator, analyst and mentor, Patrick has improved the technical skills and psychological stance of literally hundreds of traders – coaching them to become savvy market operators!